
2. Tracing OS events
In these tutorials, we will make intensive use a commercial tool to illustrate FreeRTOS mechanisms. This tool is Tracealyzer® from Percepio®.

You may take some time to visit Percepio® website:
Tracealyzer main page
Tracealyzer for FreeRTOS user manual
If you cannot get access to a Tracealyzer license (sorry for you), you may skip this tutorial and still profit from the several screenshots that you will find along these tutorials.
Otherwise, and if you want to be able to record and analyze what's happening in your FreeRTOS projects, you are highly encouraged to setup your project in order to get those OS traces. That's really helpful, and highly instructive.
The only thing you need to know at the moment is that tracing OS events requires two pieces of software:
The recorder is running on your target MCU while OS is executing. It captures and records events at runtime in a memory buffer . It is provided as a set of source files (just like FreeRTOS) you need to include and configure in your MCU project. You can see it as a spying program working from the inside of the firmware.
The Tracealyzer is a computer application which provides visual tools to help analyze OS behavior based on stored events. It uses the information gathered by the recorder and provide views into a user-friendly graphical interface.
There are two methods for transferring events stored in the MCU memory by the recorder to the Tracealyzer computer application:
Using a memory dump from the debugger while program execution is suspended (snapshot mode)
Using a real-time streaming while program executes (streaming mode)
This tutorial only covers the snapshot mode, which I find easier to setup for a start.
At time of writing, Tracealyzer version is 4.8.1. Again, I strongly encourage you to use the same version as me until you get enough understanding of the recorder integration. You can get Tracealyzer installers from the Percepio® website: https://percepio.com/tracealyzer/update. Pick up the 4.8.1 version from September 26th 2023 to be in sync with this tutorial and proceed with the installation on your computer.
1. Integrating the Recorder
1.1. Getting the Recorder source files into your project
You may get recorder source files from two locations:
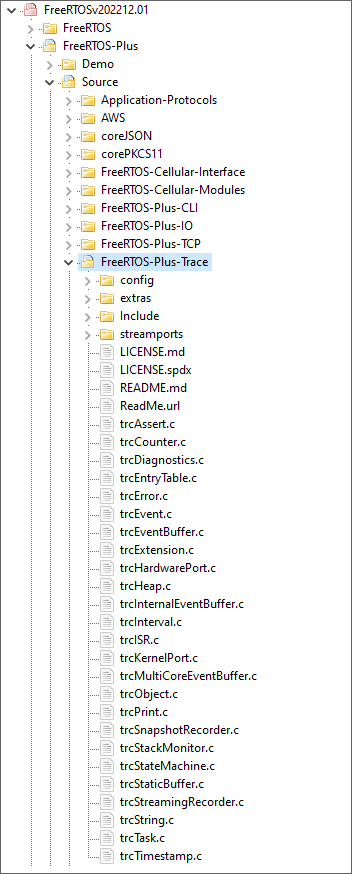
The FreeRTOS archive comes with various addons including the Percepio recorder source files. These are located in FreeRTOS-Plus\Source\FreeRTOS-Plus-Trace\ folder.
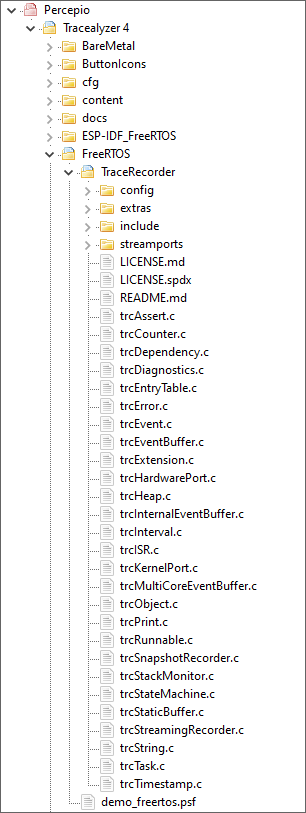
After you have downloaded and installed Percepio Tracealyzer on your computer, you'll find the recorder source files in the installation directory (e.g. C:\Program Files\Percepio\Tracealyzer 4\FreeRTOS\TraceRecorder\).
You can open the file \config\trcConfig.h in both distributions to see what you have. Be aware that if the recorder is prior to the FreeRTOS version, it might not work properly. Actually, the FreeRTOS release (v202212.01) comes with a FreeRTOS kernel in version v10.5.1 and packages the Percepio recorder in version v4.6.0 that has apparently no support update since FreeRTOS v10.4.1.
On the other hand, the recorder that comes with Tracealyzer is in version 4.8.1 and displays support for FreeRTOS up to version 10.5.1. (even through the configuration for v10.5.1 refers to v10.4.0). Anyway, we will take that one!
| FreeRTOS archive | Percepio installation folder (e.g. Program Files) |
 |  |
FreeRTOS-Plus-Trace\config\trcConfig.h | FreeRTOS\TraceRecorder\config\trcConfig.h |
After you've located the recorder source files on your computer, create a new source folder ![]() 'TraceRecorder' in your project structure and Copy/Paste source files.
'TraceRecorder' in your project structure and Copy/Paste source files.
Again, some cleanup is necessary:
Delete the /extras folder
In the /streamports folder, delete all folders except the /Jlink_RTT folder
Remove all remaining files that are neither source (.c) nor header (.h)
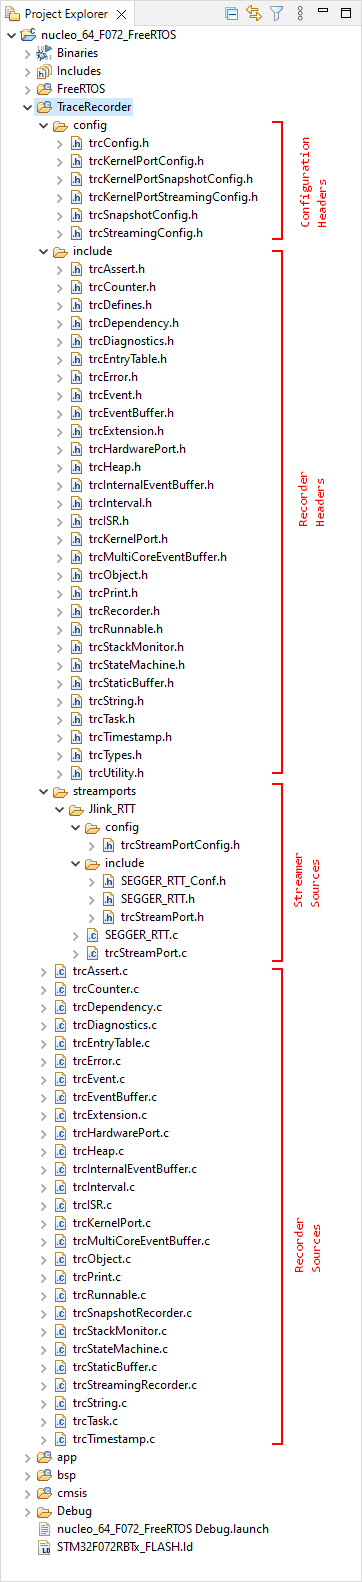
By the end of the cleanup, your project structure should look like this. That's indeed a lot of new files, but don't worry, we will just deal with a few configuration headers.
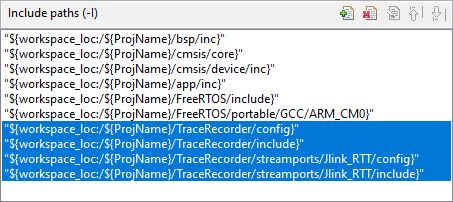
Next, add the TraceRecorder\include\ path to the build configuration and apply changes:
1.2. Configuring the Recorder
Configuring the recorder requires some attention, especially because our target has very a limited amount of RAM (16kB). Most of this configuration takes place in headers located in the /config folder of the recorder source tree:
trcConfig.h
trcKernelPortConfig.h
trcSnapshotConfig.h
trcKernelPortSnapshotConfig.h
Let us visit each of these header and see what configuration we have to do.
Open trcConfig.h:
Comment out the error message and include our target header:/****************************************************************************** * Include of processor header file * * Here you may need to include the header file for your processor. This is * required at least for the ARM Cortex-M port, that uses the ARM CMSIS API. * Try that in case of build problems. Otherwise, remove the #error line below. *****************************************************************************/ // #error "Trace Recorder: Please include your processor's header file here and remove this line." #include "stm32f0xx.h"Specify the FreeRTOS hardware port we are using:
/**
 * @def TRC_CFG_HARDWARE_PORT
 * @brief Specify what hardware port to use (i.e., the "timestamping driver").
 *
 * All ARM Cortex-M MCUs are supported by "TRC_HARDWARE_PORT_ARM_Cortex_M".
 * This port uses the DWT cycle counter for Cortex-M3/M4/M7 devices, which is
 * available on most such devices. In case your device don't have DWT support,
 * you will get an error message opening the trace. In that case, you may
 * force the recorder to use SysTick timestamping instead, using this define:
 *
 * #define TRC_CFG_ARM_CM_USE_SYSTICK
 *
 * For ARM Cortex-M0/M0+ devices, SysTick mode is used automatically.
 *
 * See trcHardwarePort.h for available ports and information on how to
 * define your own port, if not already present.
 */
#define TRC_CFG_HARDWARE_PORT TRC_HARDWARE_PORT_ARM_Cortex_M
Then apply following tuning:
#define TRC_CFG_SCHEDULING_ONLY             0
#define TRC_CFG_INCLUDE_MEMMANG_EVENTS      0
#define TRC_CFG_INCLUDE_USER_EVENTS         0
#define TRC_CFG_INCLUDE_ISR_TRACING         0
#define TRC_CFG_INCLUDE_READY_EVENTS        1
#define TRC_CFG_INCLUDE_OSTICK_EVENTS       0

#define TRC_CFG_ENABLE_STACK_MONITOR        0
#define TRC_CFG_STACK_MONITOR_MAX_TASKS     10
#define TRC_CFG_STACK_MONITOR_MAX_REPORTS   1

#define TRC_CFG_CTRL_TASK_PRIORITY          1
#define TRC_CFG_CTRL_TASK_DELAY             10
#define TRC_CFG_CTRL_TASK_STACK_SIZE        1024

#define TRC_CFG_RECORDER_BUFFER_ALLOCATION  TRC_RECORDER_BUFFER_ALLOCATION_STATIC
#define TRC_CFG_MAX_ISR_NESTING             8

#define TRC_CFG_ISR_TAILCHAINING_THRESHOLD  0
#define TRC_CFG_RECORDER_DATA_INIT          1

#define TRC_CFG_RECORDER_DATA_ATTRIBUTE

#define TRC_CFG_USE_TRACE_ASSERT            0
Open trcKernelPortConfig.h:
The recorder can operate in Snapshot mode or in Streaming mode. The Streaming mode allows for recording long traces but it requires a dedicated tutorial. Here, we deal with the Snapshot mode:/** * @def TRC_CFG_RECORDER_MODE * @brief Specify what recording mode to use. Snapshot means that the data is saved in * an internal RAM buffer, for later upload. Streaming means that the data is * transferred continuously to the host PC. * * For more information, see http://percepio.com/2016/10/05/rtos-tracing/ * and the Tracealyzer User Manual. * * Values: * TRC_RECORDER_MODE_SNAPSHOT * TRC_RECORDER_MODE_STREAMING */ #define TRC_CFG_RECORDER_MODE TRC_RECORDER_MODE_SNAPSHOTThen we need to specify our FreeRTOS version:
/**
 * @def TRC_CFG_FREERTOS_VERSION
 * @brief Specify what version of FreeRTOS that is used (don't change unless using the
 * trace recorder library with an older version of FreeRTOS).
 *
 * TRC_FREERTOS_VERSION_7_3_X				If using FreeRTOS v7.3.X
 * TRC_FREERTOS_VERSION_7_4_X				If using FreeRTOS v7.4.X
 * TRC_FREERTOS_VERSION_7_5_X				If using FreeRTOS v7.5.X
 * TRC_FREERTOS_VERSION_7_6_X				If using FreeRTOS v7.6.X
 * TRC_FREERTOS_VERSION_8_X_X				If using FreeRTOS v8.X.X
 * TRC_FREERTOS_VERSION_9_0_0				If using FreeRTOS v9.0.0
 * TRC_FREERTOS_VERSION_9_0_1				If using FreeRTOS v9.0.1
 * TRC_FREERTOS_VERSION_9_0_2				If using FreeRTOS v9.0.2
 * TRC_FREERTOS_VERSION_10_0_0				If using FreeRTOS v10.0.0
 * TRC_FREERTOS_VERSION_10_0_1				If using FreeRTOS v10.0.1
 * TRC_FREERTOS_VERSION_10_1_0				If using FreeRTOS v10.1.0
 * TRC_FREERTOS_VERSION_10_1_1				If using FreeRTOS v10.1.1
 * TRC_FREERTOS_VERSION_10_2_0				If using FreeRTOS v10.2.0
 * TRC_FREERTOS_VERSION_10_2_1				If using FreeRTOS v10.2.1
 * TRC_FREERTOS_VERSION_10_3_0				If using FreeRTOS v10.3.0
 * TRC_FREERTOS_VERSION_10_3_1				If using FreeRTOS v10.3.1
 * TRC_FREERTOS_VERSION_10_4_0				If using FreeRTOS v10.4.0
 * TRC_FREERTOS_VERSION_10_4_1				If using FreeRTOS v10.4.1
 * TRC_FREERTOS_VERSION_10_4_2				If using FreeRTOS v10.4.2
 * TRC_FREERTOS_VERSION_10_4_3				If using FreeRTOS v10.4.3
 * TRC_FREERTOS_VERSION_10_5_0				If using FreeRTOS v10.5.0
 * TRC_FREERTOS_VERSION_10_5_1				If using FreeRTOS v10.5.1 or later
 */
#define TRC_CFG_FREERTOS_VERSION TRC_FREERTOS_VERSION_10_5_1 // <-- Change this if different
Then turn off all other monitoring options:
#define TRC_CFG_INCLUDE_EVENT_GROUP_EVENTS     0
#define TRC_CFG_INCLUDE_TIMER_EVENTS           0
#define TRC_CFG_INCLUDE_PEND_FUNC_CALL_EVENTS  0
#define TRC_CFG_INCLUDE_STREAM_BUFFER_EVENTS   0
#define TRC_CFG_ACKNOWLEDGE_QUEUE_SET_SEND     0
Open trcSnapshotConfig.h:
In Snapshot mode, kernel events are recorded in RAM (as an array in a structured variable, to be precise). Because of the limited availability of RAM in our target (16kB), the number of recorded events is also limited. When we start the program, the OS life is tracked until the recorder buffer is full. If 'STOP_WHEN_FULL' option is selected, the recorder then contains the n firsts events that came after the application started. Otherwise, if 'RING_BUFFER' is selected, the recorder keeps recording, replacing older events by new ones. When the execution is suspended (manually, in the debug session), the recorder therefore contains the n lasts events being observed. Note that under intense activity, the recorder may only contains few seconds (if not milliseconds) of the OS life.
Here, let's try to catch the beginning of our OS life:
/**
 * @def TRC_CFG_SNAPSHOT_MODE
 * @brief Macro which should be defined as one of:
 * - TRC_SNAPSHOT_MODE_RING_BUFFER
 * - TRC_SNAPSHOT_MODE_STOP_WHEN_FULL
 * Default is TRC_SNAPSHOT_MODE_RING_BUFFER.
 *
 * With TRC_CFG_SNAPSHOT_MODE set to TRC_SNAPSHOT_MODE_RING_BUFFER, the
 * events are stored in a ring buffer, i.e., where the oldest events are
 * overwritten when the buffer becomes full. This allows you to get the last
 * events leading up to an interesting state, e.g., an error, without having
 * to store the whole run since startup.
 *
 * When TRC_CFG_SNAPSHOT_MODE is TRC_SNAPSHOT_MODE_STOP_WHEN_FULL, the
 * recording is stopped when the buffer becomes full. This is useful for
 * recording events following a specific state, e.g., the startup sequence.
 */
#define TRC_CFG_SNAPSHOT_MODE TRC_SNAPSHOT_MODE_STOP_WHEN_FULL
Then set the size of the recorder buffer:
/**
 * @def TRC_CFG_EVENT_BUFFER_SIZE
 * @brief Macro which should be defined as an integer value.
 *
 * This defines the capacity of the event buffer, i.e., the number of records
 * it may store. Most events use one record (4 byte), although some events
 * require multiple 4-byte records. You should adjust this to the amount of RAM
 * available in the target system.
 *
 * Default value is 1000, which means that 4000 bytes is allocated for the
 * event buffer.
 */
#define TRC_CFG_EVENT_BUFFER_SIZE 1000
And leave other options at their default values, except the size of the symbol table that can be lowered:
/**
 * @def TRC_CFG_SYMBOL_TABLE_SIZE
 * @brief Macro which should be defined as an integer value.
 *
 * This defines the capacity of the symbol table, in bytes. This symbol table
 * stores User Events labels and names of deleted tasks, queues, or other kernel
 * objects. If you don't use User Events or delete any kernel
 * objects you set this to a very low value. The minimum recommended value is 4.
 * A size of zero (0) is not allowed since a zero-sized array may result in a
 * 32-bit pointer, i.e., using 4 bytes rather than 0.
 *
 * Default value is 800.
 */
#define TRC_CFG_SYMBOL_TABLE_SIZE 200
Open trcKernelPortSnapshotConfig.h:
Adjust (lower) the maximum number of kernel objects that you want to monitor at a time
#define TRC_CFG_NTASK           6
#define TRC_CFG_NISR            4
#define TRC_CFG_NQUEUE          2
#define TRC_CFG_NSEMAPHORE      6
#define TRC_CFG_NMUTEX          2
#define TRC_CFG_NTIMER          1
#define TRC_CFG_NEVENTGROUP     2
#define TRC_CFG_NSTREAMBUFFER   2
#define TRC_CFG_NMESSAGEBUFFER  2
And finally keep string length at their nominal values:
#define TRC_CFG_NAME_LEN_TASK           15
#define TRC_CFG_NAME_LEN_ISR            15
#define TRC_CFG_NAME_LEN_QUEUE          15
#define TRC_CFG_NAME_LEN_SEMAPHORE      15
#define TRC_CFG_NAME_LEN_MUTEX          15
#define TRC_CFG_NAME_LEN_TIMER          15
#define TRC_CFG_NAME_LEN_EVENTGROUP     15
#define TRC_CFG_NAME_LEN_STREAMBUFFER   15
#define TRC_CFG_NAME_LEN_MESSAGEBUFFER  15
1.3. Enable the Recorder
The final step is to enable the tracing feature within FreeRTOS.
Turn on the configUSE_TRACE_FACILITY definition in FreeRTOSConfig.h :
/* Run time and task stats gathering related definitions. */
#define configGENERATE_RUN_TIME_STATS           	0
#define configUSE_TRACE_FACILITY                	1		// <-- Turn tracing ON
#define configUSE_STATS_FORMATTING_FUNCTIONS    	0
Then add the following at the very end of FreeRTOSConfig.h:
...

/* Integrates the Tracealyzer recorder with FreeRTOS */
#if ( configUSE_TRACE_FACILITY == 1 )
#include "trcRecorder.h"
#endif

#endif /* FREERTOS_CONFIG_H */
And finally start the recorder in the main() function:
// Main function
int main()
{
// Configure System Clock
SystemClock_Config();
// Initialize LED & Button pin
BSP_LED_Init();
BSP_PB_Init();
// Initialize Debug Console
BSP_Console_Init();
my_printf("Console ready!\r\n");
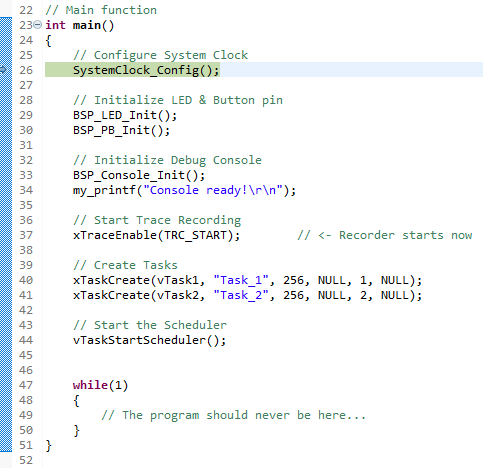
// Start Trace Recording
xTraceEnable(TRC_START); // <- Recorder starts now
// Create Tasks
xTaskCreate(vTask1, "Task_1", 256, NULL, 1, NULL);
xTaskCreate(vTask2, "Task_2", 256, NULL, 2, NULL);
// Start the Scheduler
vTaskStartScheduler();
while(1)
{
// The program should never be here...
}
}
Note that the recorder must be started before any OS event occurs, therefore before any object or task creation and obviously before the scheduler starts.
Save all ![]() and make sure that the project builds
and make sure that the project builds ![]() without any error or warnings. Repair if needed by reviewing the above settings.
without any error or warnings. Repair if needed by reviewing the above settings.
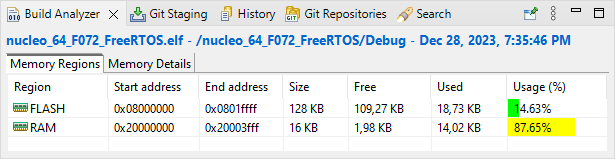
You should take care of the reported level of bss memory since it includes the amount of memory that we reserved for both the FreeRTOS heap (7kB) and for the recorder (4kB). Remember that STM32F072 only features 16kB of RAM. Here, it's almost full...
Fortunately, the linker won't build if you exceed the amount of available RAM. You can try and double the recorder capacity for instance:
#define TRC_CFG_EVENT_BUFFER_SIZE 2000and you'll see:
nucleo_64_F072_FreeRTOS.elf section `.bss' will not fit in region `RAM'
region `RAM' overflowed by 1976 bytes
collect2.exe: error: ld returned 1 exit status
make: *** [makefile:69: nucleo_64_F072_FreeRTOS.elf] Error 1
"make all" terminated with exit code 2. Build might be incomplete.
Then go back to 1000...
2. Recording OS events
Before experimenting the tracing, let us speed things up in vTask1() and vTask2() in order to get more recorded events in a short time window. Set the LED toggle period to 30ms, and the message display every 100ms:
/*
 *	Task1 toggles LED every 30ms
 */
void vTask1 (void *pvParameters)
{
	while(1)
	{
		BSP_LED_Toggle();
		vTaskDelay(30);		// <-- Change here
	}
}

/*
 *	Task2 sends a message to console every 100ms
 */
void vTask2 (void *pvParameters)
{
	uint16_t count;
	count = 0;

	while(1)
	{
		my_printf("Hello %2d from task2\r\n", count);
		count++;
		vTaskDelay(100);	// <-- Change here
	}
}
Save all ![]() , make sure that the project still builds
, make sure that the project still builds ![]() without any error or warnings.
without any error or warnings.
 | - - |
Launch a debug session ![]() . You should get the debugger waiting at the beginning of main():
. You should get the debugger waiting at the beginning of main():
Using the Expression view, add ![]() the following expressions (global variables):
the following expressions (global variables):
RecorderData
RecorderDataPtr
sizeof(RecorderData)
&RecorderData
Then select &RecorderData, and copy into the clipboard its address in memory:
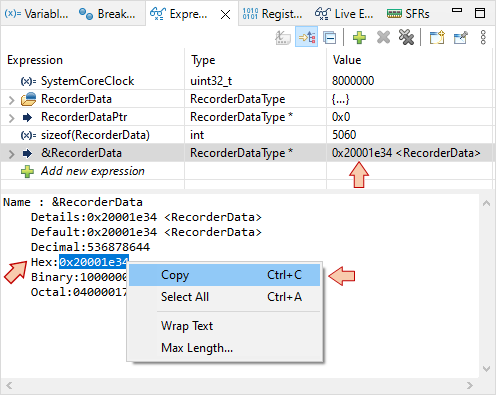
Also note that the size of the RecorderData variable is 5060 bytes. We'll need this information in a moment.
Step over ![]() the code until you pass the xTraceEnable(TRC_START) function and take a look (unfold) the RecorderData structure in the Expression view. You'll see that a lot of initializations have been performed. Notice that numEvents member is set to 1 and that RecorderDataPtr is a pointer that now points to the DataRecorder structured variable.
the code until you pass the xTraceEnable(TRC_START) function and take a look (unfold) the RecorderData structure in the Expression view. You'll see that a lot of initializations have been performed. Notice that numEvents member is set to 1 and that RecorderDataPtr is a pointer that now points to the DataRecorder structured variable.
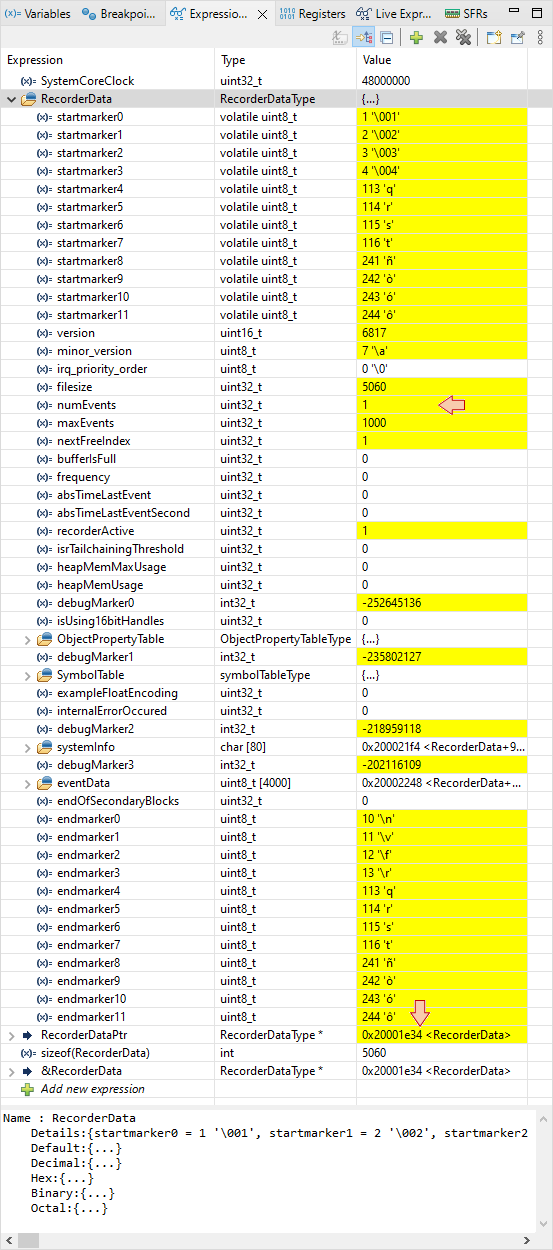
Then step over ![]() again the two xTaskCreate() functions while watching the numEvents member of DataRecorder. You'll see that each task creation corresponds to 2 events in the recorder. This demonstrates that the tracking mechanism is up and running.
again the two xTaskCreate() functions while watching the numEvents member of DataRecorder. You'll see that each task creation corresponds to 2 events in the recorder. This demonstrates that the tracking mechanism is up and running.
Now, just run the program ![]() , wait a little while (a couple of seconds). Watch the LED and the console to make sure that the program works as expected (very fast blinking/printing), and then click the suspend
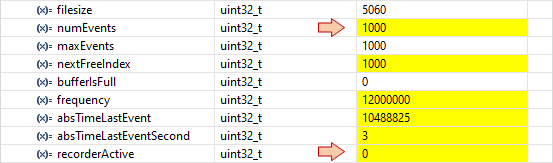
, wait a little while (a couple of seconds). Watch the LED and the console to make sure that the program works as expected (very fast blinking/printing), and then click the suspend ![]() button. How high is the numEvent variable ? If it reached 1000, that means that recorder is full, and that it doesn't record anything anymore. In that case, the recorderActive flag should be 0:
button. How high is the numEvent variable ? If it reached 1000, that means that recorder is full, and that it doesn't record anything anymore. In that case, the recorderActive flag should be 0:
At this step, we have a very valuable information stored in the recorder memory, but it's not human-readable in its current form. What we need to do now is to transfer the MCU memory segment that corresponds to the DataRecorder variable into a file on your host computer. That action is called a memory dump.
Open the
 Memory view
Click
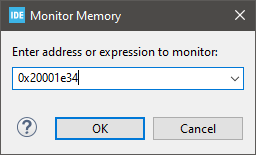
 Add Memory Monitor
- Paste the previously copied address (alternatively, you can also enter &DataRecorder, or RecorderDataPtr) and click OK.
Click the
 Export button in the Memory view:
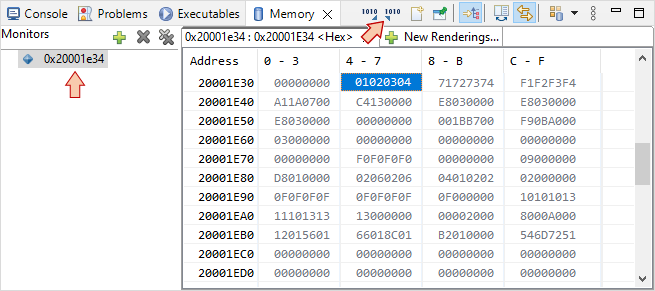
Then carefully fill up the popup window:
Select RAW Binary as export Format
Make sure that Start address is the one of the RecorderData structure you got above
Set the Length to anything bigger than the recorder length (you remember? It is 5060 bytes, so let say 6000)
Give a name such as ram.bin to the destination file
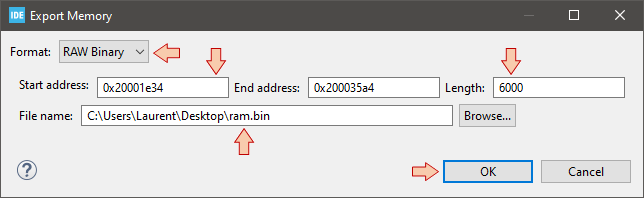
Click OK. You should get a file ram.bin created on your computer, which is a copy of the actual STM32 memory content.
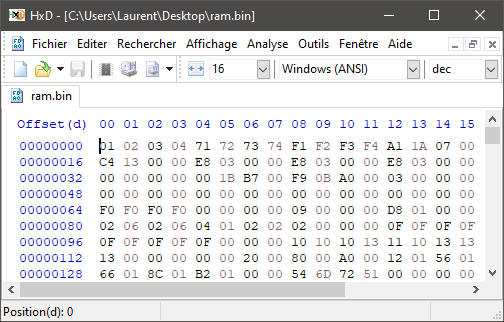
If you have an Hex editor at hand on your computer (by the way, that's a very useful utility. Here, I'm using HxD, which is available here https://mh-nexus.de/en/hxd/), you can open and read the ram.bin file and see that it contents the very same bytes than the ones you see in the memory view of the IDE.
And that's when Tracealyzer now enters the game.
3. Analyzing the trace
From Windows launch menu, start Tracealyzer.
Within Tracealyzer, select File →Open→Open File and browse to ram.bin. You can also just drag and drop the ram.bin file into the Tracealyzer window. The trace opens...
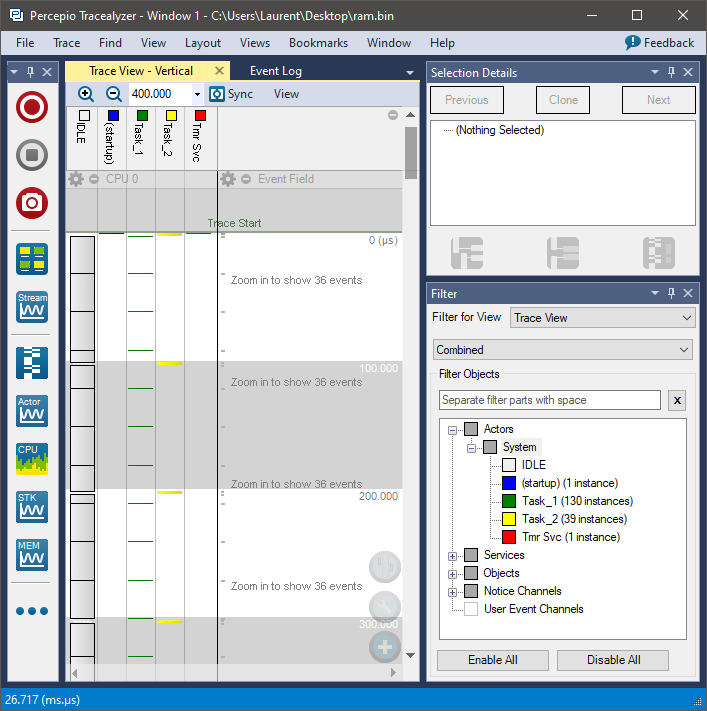
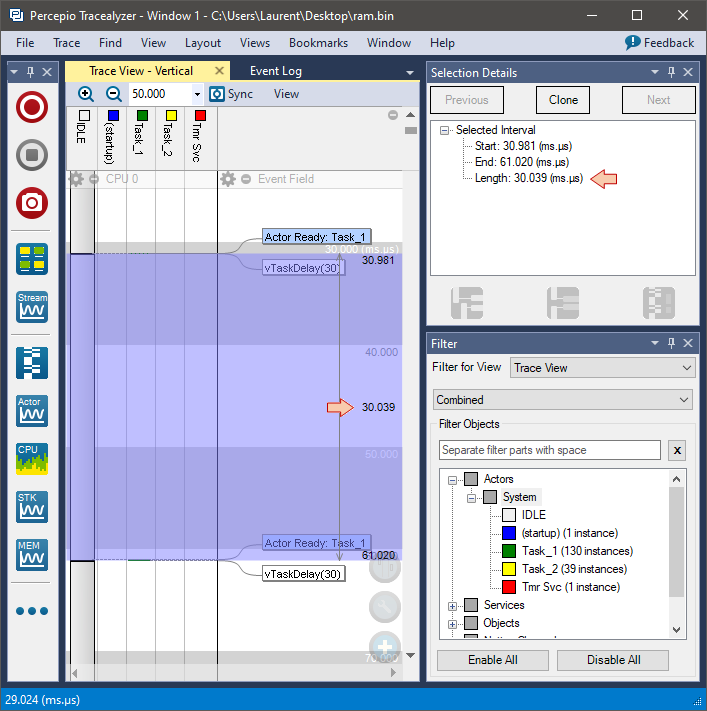
On the left, vertical lanes represent the system tasks execution along a vertical time line. Task priority is increasing from left to right. You can scroll and zoom into this view using the mouse wheel and CTRL key and use right filters to display various information.
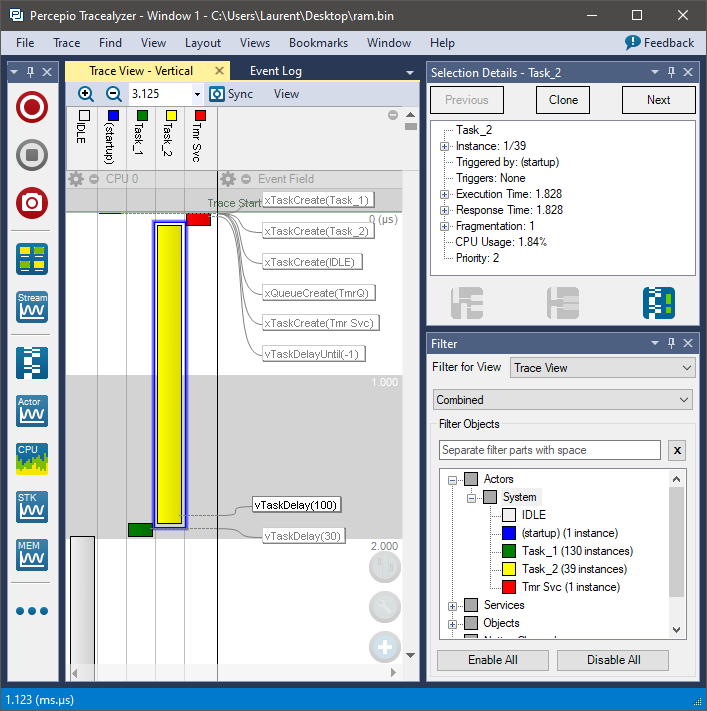
You can measure time by click-dragging the mouse in the main view. For instance let us verify that Task_1 is executed every 30ms as programmed:
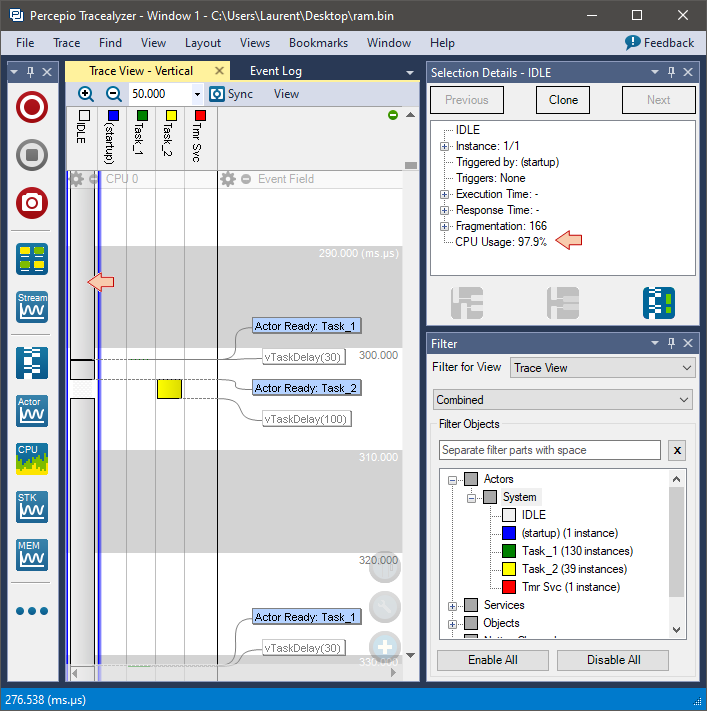
Selecting the task IDLE (left lane), you get an idea of the CPU load. In the figure below, the IDLE task is running 97.9% of time. In other words, the CPU is only busy with our Task_1 and Task_2 for 2.1% of the time... Not too busy after all...
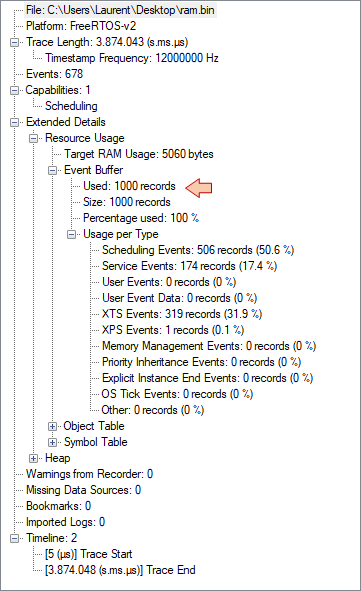
Using the View menu, you get access to more information. Open for instance View→Trace Overview. This view provides a summary of the recorder trace. You can see that 1000 events have been recorded in 3.8s. If you need longer traces, you need a larger recorder buffer, which is difficult with a limited amount of RAM. In the future you will learn how to run the recorder in the steaming mode that allows for virtually unlimited trace length recording.
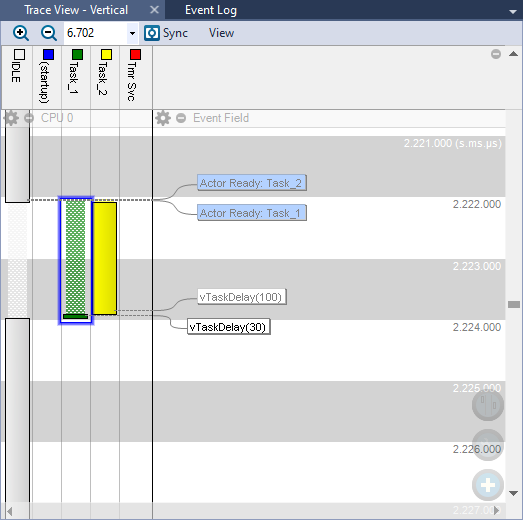
Now try and open Views → Actor Instance Graphs. Then in the drop-down menu, select Wait time. You get a view of waiting time for each task. The waiting time corresponds to the time a task waits, from the moment it is ready to execute, to the moment it actually runs. In the graph below, one can see that Task_2 (yellow) never waits. That's fortunate, because Task_2 is of highest priority. Task_1 (green) wait time is also zero most of the time, but on a regular period, it had to wait about 2ms before being executed.
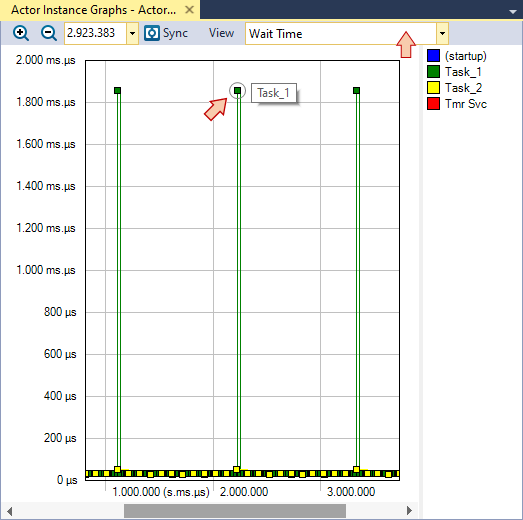
Double-clicking the point of interest in the above view align all the Tracealyzer opened views so that you can get a better understanding of a local situation. In this case, we understand that, at regular time interval, both Task_1 and Task_2 are simultaneously ready. Task_2 has higher priority, therefore Task_1 waits for the CPU to be available (i.e. until Task_2 terminates).
4. Using Percepio® Eclipse plugin
The process of memory dumping and loading of Tracealyzer is not difficult, but it can be made even easier using a Percepio plugin within STM32CubeIDE.
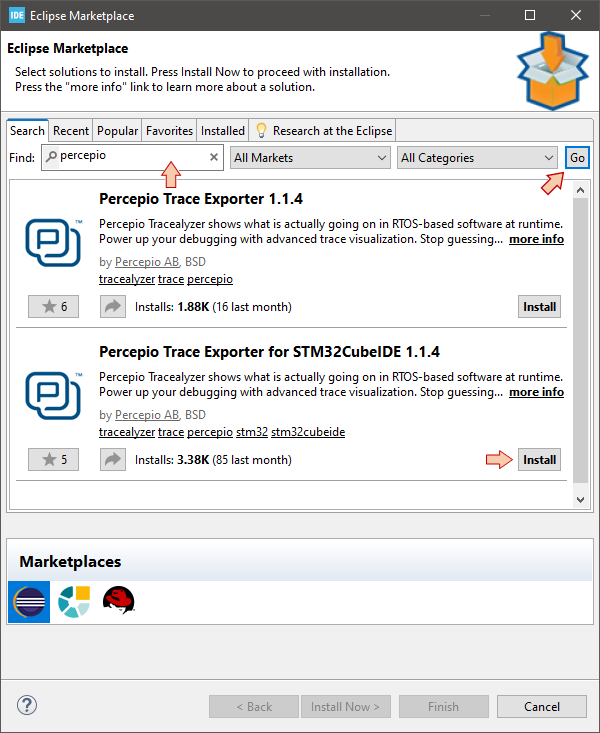
Open Help → ![]() Eclipse Marketplace... and search for percepio plugins. Then install the Trace Exporter for STM32CubeIDE.
Eclipse Marketplace... and search for percepio plugins. Then install the Trace Exporter for STM32CubeIDE.
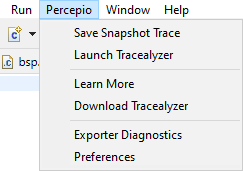
When done, you'll need to restart the IDE. Note that a new Percepio entry has been added in the top menu:
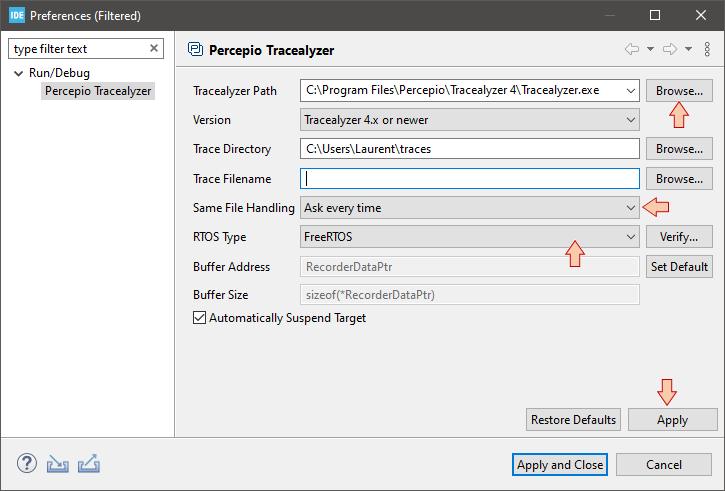
Go to Percepio → Preferences and review the settings, in particular the Tracealyzer Path that must indicate the full path to the Tracealyzer executable. I also recommend filling the Trace Filename field with the file of your choice (e.g., "ram.bin") so that every new trace just overwrites the previous one and then avoids filling your hard drive with tons of trace files.
You may notice that the plugin does nothing more than automating the memory dump process that you've done manually just before. As you did, it uses RecoredDataPtr (the pointer) to locate the RecorderData structure in memory and then uses the size sizeof(*RecoredDataPtr) to adjust the dump length. No magic here! Still, very useful.
When done, the process for loading a trace into Tracealyzer is as simple as:
Start a debug session

Run the program for a little while
 to let the recorder capture some events
Suspend execution

Go to Percepio → Save Snapshot Trace. It opens Tracealyzer and loads the last recorded events automatically. If already opened, you'll get a dialog box asking for reloading.
- Log in to post comments