
6. Tracing User Events
User events is a trace recorder feature that pretty works like a printf() function, directly into the recorder. It's worth knowing how to use it as it is of great help for debugging.
First, you need to declare the user event channels you want to use as global variables. Here, we will use two channels 'ue1' and 'ue2'.
ue1 will be used to monitor the count value in Task_1
ue2 will be used for general purpose messages from Task_2
// Trace User Events Channels
traceString ue1, ue2;
Then, in the body of main(), before the scheduler is started, we need to register the user event channels:
...
	// Register the Trace User Event Channels
	 ue1 = xTraceRegisterString("count");
	 ue2 = xTraceRegisterString("msg");
...
Now we can use ue1 and ue2 channels to issue printf-like messages into the recorder.
Let us print out the value of count in Task_1:
/*
 *	Task_1 toggles LED every 10ms
 */
void vTask1 (void *pvParameters)
{
	portTickType  xLastWakeTime;
	uint16_t      count = 0;

	// Initialize timing
	xLastWakeTime = xTaskGetTickCount();

	while(1)
	{
		// Toggle LED only if button is released
		if (!BSP_PB_GetState())
		{
			BSP_LED_Toggle();
			count++;
		}

		// Release semaphore every 10 count
		if (count == 10)
		{
			xSemaphoreGive(xSem);
			count = 0;
		}

		// Send count value into trace UEC
		vTracePrintF(ue1, "%d", count);

		// Wait here for 10ms since last wakeup
		vTaskDelayUntil (&xLastWakeTime, (10/portTICK_RATE_MS));
	}
}
And display a cool message whenever the semaphore was successfully taken in Task_2:
/*
 *	Task_2 sends a message to console when xSem semaphore is given
 */
void vTask2 (void *pvParameters)
{
	portBASE_TYPE  xStatus;
	uint16_t       count = 0;

	// Take the semaphore once to make sure it is empty
	xSemaphoreTake(xSem, 0);

	while(1)
	{
		// Wait here for Semaphore with 2s timeout
		xStatus = xSemaphoreTake(xSem, 2000);

		// Test the result of the take attempt
		if (xStatus == pdPASS)
		{
			// The semaphore was taken as expected
			vTracePrint(ue2, "Yep!");

			// Display console message
			my_printf("Hello %2d from task2\r\n", count);
			count++;
		}

		else
		{
			// The 2s timeout elapsed without Semaphore being taken
			// Display another message
			my_printf("Hey! Where is my semaphore?\r\n");
		}
	}
}
Note that we used both vTracePrint() and vTracePrintF() functions. vTracePrint() is faster but it doesn't format numbers.
If you try to build ![]() at this step, you'll get a linker error:
at this step, you'll get a linker error:
C:/STM/workspace_tuto/nucleo_64_F072_FreeRTOS/Debug/../app/src/main.c:52: undefined reference to `xTraceRegisterString'
C:/STM/STM32CubeIDE/plugins/com.st.stm32cube.ide.mcu.externaltools.gnu-tools-for-stm32.11.3.rel1.win32_1.1.100.202309141235/tools/bin/../lib/gcc/arm-none-eabi/11.3.1/../../../../arm-none-eabi/bin/ld.exe: C:/STM/workspace_tuto/nucleo_64_F072_FreeRTOS/Debug/../app/src/main.c:53: undefined reference to `xTraceRegisterString'
That's simply because User Events are not yet included in the trace recorder capabilities. So let's do that. Open trcConfig.h and turn thee User Events feature on:
/**
 * @def TRC_CFG_INCLUDE_USER_EVENTS
 * @brief Macro which should be defined as either zero (0) or one (1).
 *
 * If this is zero (0), all code related to User Events is excluded in order
 * to reduce code size. Any attempts of storing User Events are then silently
 * ignored.
 *
 * User Events are application-generated events, like "printf" but for the
 * trace log, generated using vTracePrint and vTracePrintF.
 * The formatting is done on host-side, by Tracealyzer. User Events are
 * therefore much faster than a console printf and can often be used
 * in timing critical code without problems.
 *
 * Note: In streaming mode, User Events are used to provide error messages
 * and warnings from the recorder (in case of incorrect configuration) for
 * display in Tracealyzer. Disabling user events will also disable these
 * warnings. You can however still catch them by calling xTraceErrorGetLast
 * or by putting breakpoints in xTraceError and xTraceWarning.
 *
 * Default value is 1.
 */
#define TRC_CFG_INCLUDE_USER_EVENTS 1
You know what to do now... Save ![]() , build
, build ![]() and start a debug
and start a debug ![]() session. Run
session. Run ![]() the application for a little while, and display the trace in Tracealyzer.
the application for a little while, and display the trace in Tracealyzer.
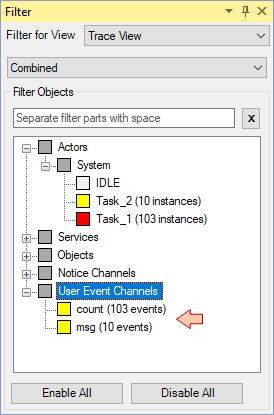
You should be able to see the User Events Channels in the Filter view now:
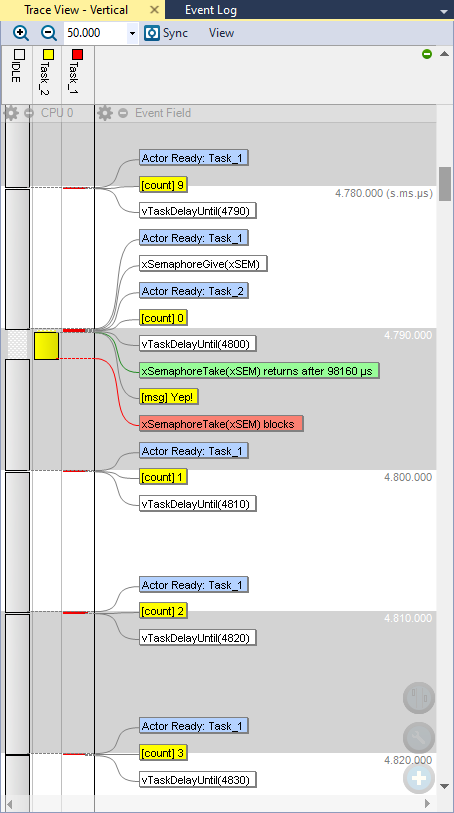
And now the result (yellow tags):
Nice! So basically, you've just implemented another printf() option. There are pros and cons of replacing the traditional output to the console via UART by the trace User Events:
On the pros side, this way to perform printf() is a lot (>x100) faster in execution. That's because strings are just copied in RAM and there is no slow serial interface latency to deal with. For the application performance, we can consider that using User Events is much less intrusive than a traditional printf() that takes time during which the CPU might be kept busy. Being able to browse a large history of User Events is also very interesting for debug.
On the cons side, we somehow loose the immediacy of seeing events live in the console. So both approaches are valid and complementary. That's just another tool in your software engineer toolbox. Up to you to imagine its best use.
Open Views → User Event Signal Plot
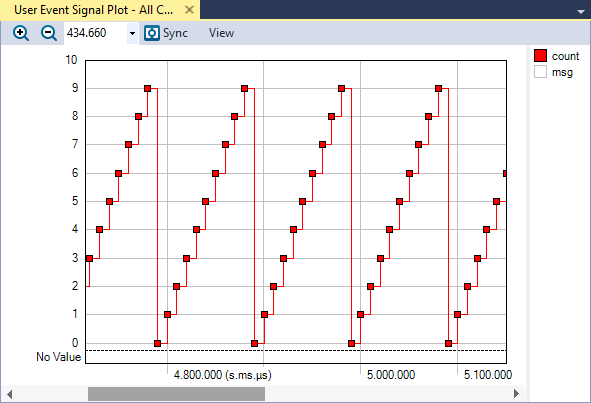
Nice again! As for all views in Tracealyzer, you can double-click a dot on this plot and get the location aligned in all your opened views.
 | - - |
- Log in to post comments