
14. Trace streaming
In the previous tutorials, we have used Percepio® Tracealyzer and the embedded recorder to trace FreeRTOS events. We've been using the so-called "Snapshot mode", that uses a region of RAM to record events during execution. We then needed to dump the memory and opened the trace offline in Tracealyzer to explore the recorder contents.
Using the Snapshot mode, it is impossible to gather long recordings. Thousands of kernel events occur every second and the amount of embedded memory we can afford is so limited that in practice, only few seconds, or even milliseconds of recording are possible. That's already nice through, but as we've seen in the previous tutorial, it is often necessary to study the OS life over extended period of time, especially when we want to catch worst cases of preemption that might overflow the Stacks.
Beside the Snapshot mode, Percepio® implements a Streaming mode in the recorder. The idea is very simple: instead of recording events inside of the embedded memory, we stream kernel events directly in real time to the host computer. Doing so, tracing is virtually unlimited in time (unless your hard drive is very tiny).
Yet, there are two things to keep in mind:
We still need comfortable data buffers in memory to cope with the poor data bandwidth that we have with the cheap debug probe that is embedded on the Nucleo board. The situation is very different when using professional standalone probes, but for us and for now, Streaming will not bring the expected savings in term of memory usage.
The Streaming mode creates an additional task TzCtrl that periodically manages the transfer of data buffers. It puts a little extra load on the CPU that is usually not a problem.
So let see step by step what we have to do to get this working.
1. ST-Link becomes J-Link

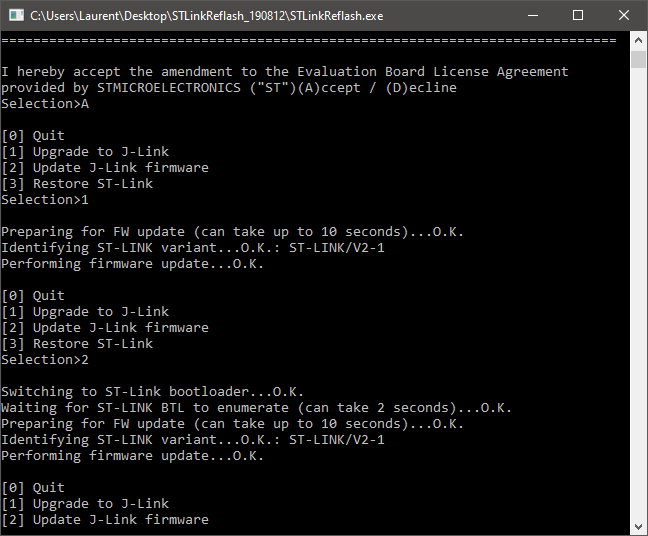
Percepio® only supports Streaming with J-Link debug probes from the Segger® company. Luckily for us, Segger® provides a tool that can re-flash an embedded ST-Link probe and turn it into a J-Link one. You shouldn't expect high performances through (a standalone professional J-Link costs about 1k€) but it works good enough for our purposes.
Visit the link hereafter and download the ST-Link Reflash Utility:
https://www.segger.com/downloads/jlink#STLink_Reflash
You can then follow instructions provided here to convert your ST-Link into a J-Link probe:
https://www.segger.com/products/debug-probes/j-link/models/other-j-links/st-link-on-board/
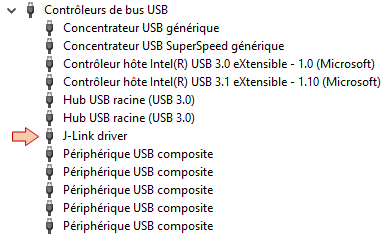
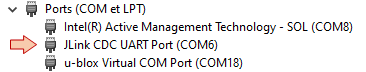
By the end of the conversion process, it's a good idea to make sure that your computer correctly recognizes your Nucleo board as a J-Link probe now, with a J-Link CDC interface (virtual COM port) that we can use for the printf() function and the console:
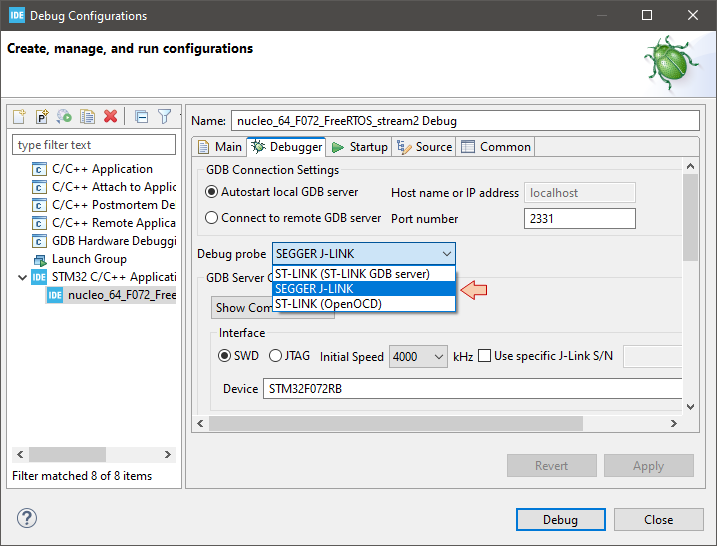
After having converted the debug probe, you can keep using the Nucleo board with STM32CubeIDE pretty much the same way as with the ST-Link you had before. You'll just have to review the debug/launch configuration in order to set the debug probe as a J-Link instead of a ST-Link. Apart from this settings, there's no difference in having a J-link in place of an ST-Link. Actually, it works even better (it is faster in starting a debug session).
2. Recorder configuration
Here, I'm making the assumption that you already installed the recorder as shown in tutorial 2.Tracing OS Events. If not, then you first have to go there and complete all the steps described in section 1. Then, in order to setup the recorder for Streaming, there few settings we need to adjust.
In trcKernelPortConfig.h, change the mode from Snapshot to Streaming
/**
 * @def TRC_CFG_RECORDER_MODE
 * @brief Specify what recording mode to use. Snapshot means that the data is saved in
 * an internal RAM buffer, for later upload. Streaming means that the data is
 * transferred continuously to the host PC.
 *
 * For more information, see http://percepio.com/2016/10/05/rtos-tracing/
 * and the Tracealyzer User Manual.
 *
 * Values:
 * TRC_RECORDER_MODE_SNAPSHOT
 * TRC_RECORDER_MODE_STREAMING
 */
#define TRC_CFG_RECORDER_MODE TRC_RECORDER_MODE_STREAMING
In trcStreamingConfig.h, lower the default settings to suit our needs without overloading the limited streaming bandwidth that we have:
#define TRC_CFG_ENTRY_SLOTS               12
#define TRC_CFG_ENTRY_SYMBOL_MAX_LENGTH   14
Very important: Since we are involving a new TzCtrl task, we need to tune its priority, periodicity and Stack size. This is done in tcrConfig.h. In particular, we really need to lower the default Stack size that would take 4kB of Heap memory otherwise!
#define TRC_CFG_CTRL_TASK_PRIORITY          1
#define TRC_CFG_CTRL_TASK_DELAY             50
#define TRC_CFG_CTRL_TASK_STACK_SIZE        configMINIMAL_STACK_SIZE
#define TRC_CFG_RECORDER_BUFFER_ALLOCATION  TRC_RECORDER_BUFFER_ALLOCATION_STATIC
Finally, we have to set the size of the uplink streaming buffer. This is done in /streamports/Jlink_RTT/config/trcStreamPortConfig.h. Percepio® recommends no less than 4096 bytes with on-board (OB) probes, but that's a lot considering the little memory we have. Let's try to make it work with half of that:
#define TRC_CFG_STREAM_PORT_USE_INTERNAL_BUFFER                              0
#define TRC_CFG_STREAM_PORT_INTERNAL_BUFFER_SIZE                             2048
#define TRC_CFG_STREAM_PORT_INTERNAL_BUFFER_WRITE_MODE                       TRC_INTERNAL_EVENT_BUFFER_OPTION_WRITE_MODE_DIRECT
#define TRC_CFG_STREAM_PORT_INTERNAL_BUFFER_TRANSFER_MODE                    TRC_INTERNAL_EVENT_BUFFER_OPTION_TRANSFER_MODE_ALL
#define TRC_CFG_STREAM_PORT_INTERNAL_BUFFER_CHUNK_SIZE                       1024
#define TRC_CFG_STREAM_PORT_INTERNAL_BUFFER_CHUNK_TRANSFER_AGAIN_SIZE_LIMIT  256
#define TRC_CFG_STREAM_PORT_INTERNAL_BUFFER_CHUNK_TRANSFER_AGAIN_COUNT_LIMIT 5

#define TRC_CFG_STREAM_PORT_RTT_UP_BUFFER_SIZE                               2048		// <- This is our streaming buffer

#define TRC_CFG_STREAM_PORT_RTT_DOWN_BUFFER_SIZE                             32
#define TRC_CFG_STREAM_PORT_RTT_UP_BUFFER_INDEX                              1
#define TRC_CFG_STREAM_PORT_RTT_DOWN_BUFFER_INDEX                            1
#define TRC_CFG_STREAM_PORT_RTT_MODE                                         SEGGER_RTT_MODE_NO_BLOCK_SKIP
3. Time to stream!
We'll make up a simple application to test our streaming configuration. A basic two-tasks program with:
- Task_1: toggles a LED every 100ms
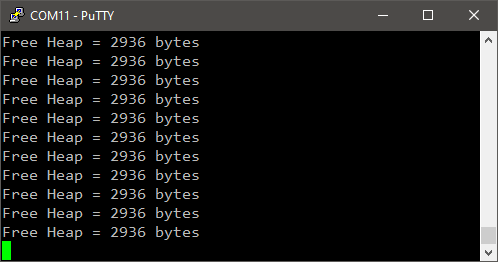
- Task_2: reports the free Heap into the console every 500ms
/*
* main.c
*
* Created on: Dec 24, 2023
* Author: Laurent
*/
#include "stm32f0xx.h"
#include "main.h"
#include "bsp.h"
// Static functions
static void SystemClock_Config (void);
// FreeRTOS tasks
void vTask1 (void *pvParameters);
void vTask2 (void *pvParameters);
// Main function
int main()
{
// Configure System Clock
SystemClock_Config();
// Initialize LED & Button pin
BSP_LED_Init();
// Initialize Debug Console
BSP_Console_Init();
my_printf("Console ready!\r\n");
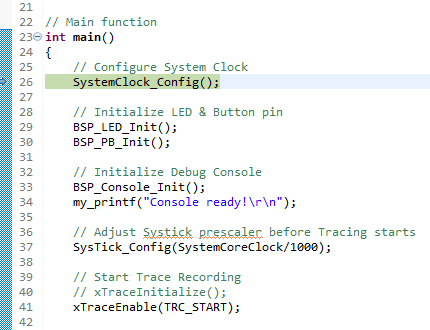
// Adjust Systick prescaler before Tracing starts
// Not doing this produces wrong time scale in Tracealyzer
SysTick_Config(SystemCoreClock/1000);
// Start Trace Recording
xTraceEnable(TRC_START);
// Create Tasks
xTaskCreate(vTask1, "Task_1", 256, NULL, 2, NULL);
xTaskCreate(vTask2, "Task_2", 256, NULL, 3, NULL);
// Start the Scheduler
vTaskStartScheduler();
while(1)
{
// The program should never be here...
}
}
/*
* Task1 toggles LED every 100ms
*/
void vTask1 (void *pvParameters)
{
while(1)
{
BSP_LED_Toggle();
vTaskDelay(100);
}
}
/*
* Task2 sends a message to console every 500ms
*/
void vTask2 (void *pvParameters)
{
uint32_t free_heap_size;
while(1)
{
free_heap_size = xPortGetFreeHeapSize();
my_printf("Free Heap = %d bytes\r\n", free_heap_size);
vTaskDelay(500);
}
}
First, make sure the program builds and execute without problems.
Second, start a debug ![]() session, but do not start the program execution yet. The program should be suspended on first line of main():
session, but do not start the program execution yet. The program should be suspended on first line of main():
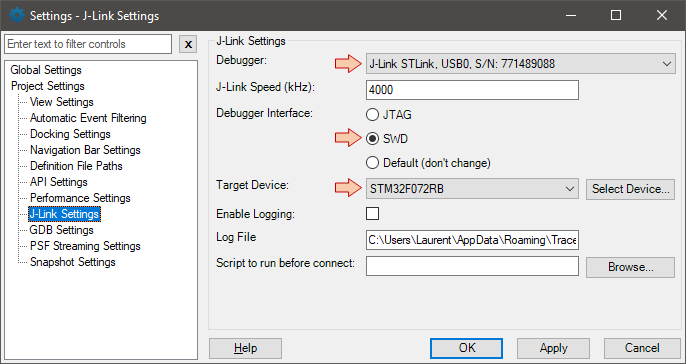
Third, launch Percepio® Tracealyzer. From the main menu, open File→Settings and check the following options,
- in the J-Link Settings:
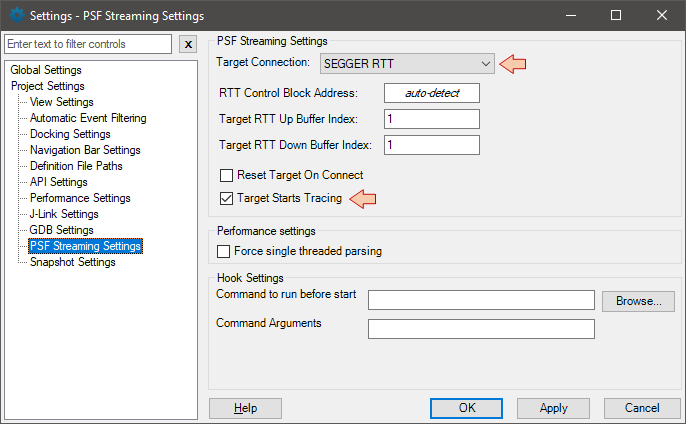
- And then in the PSF Streaming Settings:
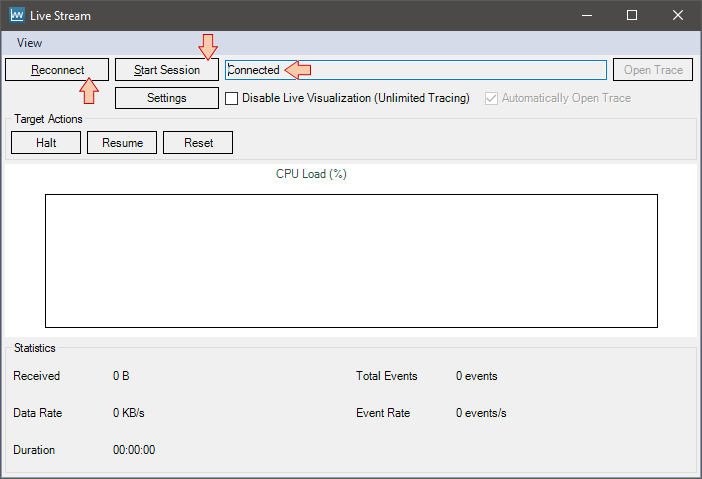
Close the Settings dialog, and then open Trace→Open Live Stream Tool. In that order:
- Click first on Connect (or Reconnect). Make sure that the status is "Connected".
- Then click on Start Session. Make sure that the status is now "Starting session".
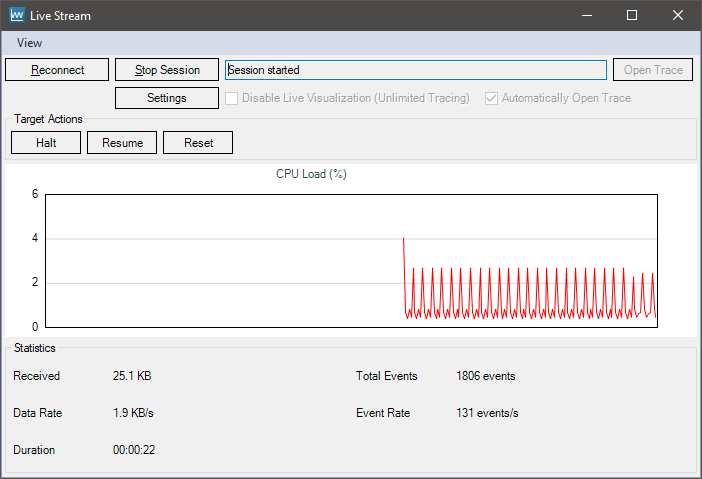
Once you got the "Starting session" status, go back to your debug session in STM32CubeIDE and then resume ![]() the program execution. Streaming starts as soon as the program reaches the xTraceEnable(TRC_START) function.
the program execution. Streaming starts as soon as the program reaches the xTraceEnable(TRC_START) function.
Then you should see the CPU Load graph slowly scrolling horizontally toward the left with time:
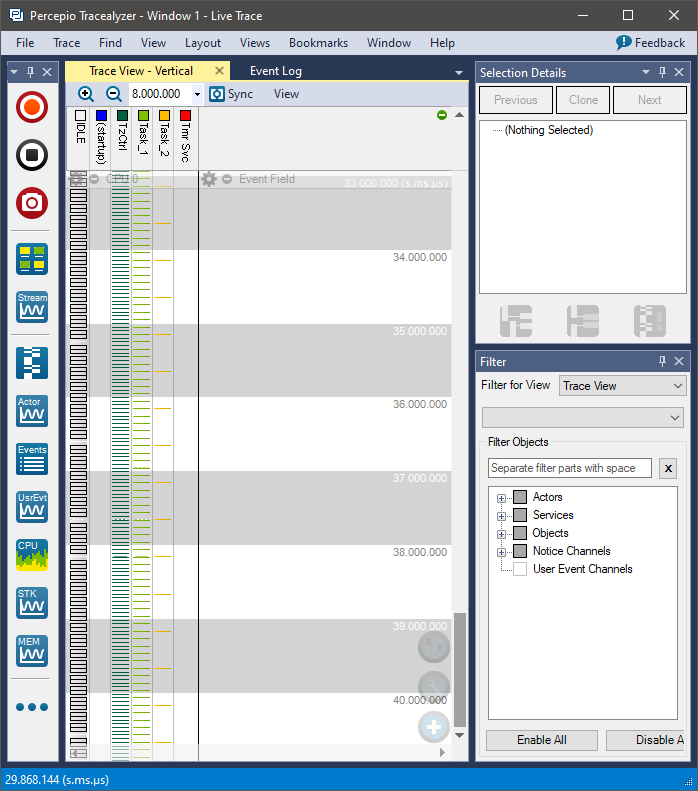
And the Trace View scrolling vertically. You can notice the additional task TzCtrl, that comes with the Streaming mode of the recorder. It has a priority level of 1 and activates every 50ms as configured.
When you think the recording has been long enough, you can suspend the code execution![]() in the debugger first, and then click the Stop Session button in the Live Stream dialog.
in the debugger first, and then click the Stop Session button in the Live Stream dialog.
You can now navigate within Tracealyzer views and analyze your trace the usual way.
4. Monitoring tasks Stacks
If you want, you can get the High Water Marks (Stacks usage) directly in Tracealyzer. That's perhaps more convenient than printing those into the console as we did in the previous tutorial.
To do that you must enable the Stacks monitoring in trcConfig.h:
#define TRC_CFG_ENABLE_STACK_MONITOR       1
#define TRC_CFG_STACK_MONITOR_MAX_TASKS    10
#define TRC_CFG_STACK_MONITOR_MAX_REPORTS  1
Note that monitoring Stack usage is also possible in Snapshot mode with the same above settings. The reason I did not introduce this earlier is that reporting Stacks watermarks involves the TzCtrl task, even without Streamingn which has its own footprint in both memory and CPU load. I didn't want to introduce this earlier.
And for those who don't have a Tracealyzer license, you still can printout your Stacks High Water Marks in the console (please, do it!).
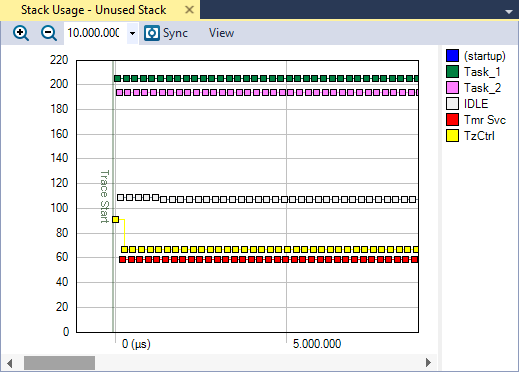
For the lucky ones, here is a example of the plot you can get. According to what we see below, we could easily lower the size of both Task_1 and Task_2 Stacks. There is room for that.
 | - - |
- Log in to post comments